Skip to content

Could my job run faster? How to identify GPU waste

Why should you care about GPU efficiency?

Optimizing your GPU usage directly accelerates research velocity. As compute power at Mila is a shared resource, efficient jobs on the cluster bring a two-sided advantage:

  • For you: Eliminating bottlenecks speeds up your training times and helps unearth hidden bugs in your data loaders or model architectures. With properly sized compute requests and efficient utilization, your jobs will be started sooner and will get useful results faster.
  • For Mila: Maximizing efficiency frees up cluster nodes, resulting in shorter queue times and more parallel experiments across the institute.

In other words, efficient compute utilization makes Mila research thrive.

The basics of compute efficiency: Utilization vs. Occupancy

nvidia-smi is a useful first check, but its utilization metric has limitations: it reports "100% Utilization" as soon as any kernel is running on the GPU, regardless of how much of the hardware is actually in use. For a more precise view, look at Streaming Multiprocessor (SM) Occupancy, which measures what fraction of the GPU's computing units are actively working. More context is available in this external post on GPU utilization metrics.

Use the table below as a reference to evaluate your SM occupancy:

SM Occupancy Assessment
< 5% Critical waste
~10% Poor utilization — the GPU is mostly waiting
~30% Good utilization
≥ 50% Great / optimized utilization

How to diagnose your jobs today?

You can self-diagnose using these framework-agnostic methods.

Method While job is running After job has run
Weights&Biases
nvidia-smi command
nvidia-smi log report
Tensorboard visualization of Pytorch profiler data
Clusters portals

Method A: Weights & Biases

If you use WandB, go to the System tab of your run to find data on GPU utilization, CPU usage, and memory. See Diagnose training bottlenecks for details.

Method B: The interactive check

During a job, you can srun into your allocated node and run a basic check:

1
2
3
4
# Check GPU utilization and power draw
nvidia-smi

# High power draw (Watts) is usually a good signal of active GPU utilization.

Method C: The NVSMI log

When a job has run on the cluster, an output file is created. Its default name is slurm-<JOB_ID>.out. This file contains the output of your experiment, along with a section NVSMI LOG containing metrics such as the GPU and memory utilizations.

Example
  ======== GPU REPORT ========

  ==============NVSMI LOG==============

  Timestamp                                              : Mon Jun  8 15:08:15 2026
  Driver Version                                         : 580.159.03
  CUDA Version                                           : 13.0

  Attached GPUs                                          : 2
  GPU 00000000:61:00.0
     Accounting Mode                                    : Enabled
     Accounting Mode Buffer Size                        : 4000
     Accounted Processes
        Process ID                                     : 3072883
              GPU Utilization                            : 12 %
              Memory Utilization                         : 3 %
              Max memory usage                           : 998 MiB
              Time                                       : 86816 ms
              Is Running                                 : 0

  GPU 00000000:CA:00.0
     Accounting Mode                                    : Enabled
     Accounting Mode Buffer Size                        : 4000
     Accounted Processes
        Process ID                                     : 3072884
              GPU Utilization                            : 15 %
              Memory Utilization                         : 3 %
              Max memory usage                           : 998 MiB
              Time                                       : 86868 ms
              Is Running                                 : 0

  Mon Jun  8 15:08:15 2026       
  +-----------------------------------------------------------------------------------------+
  | NVIDIA-SMI 580.159.03             Driver Version: 580.159.03     CUDA Version: 13.0     |
  +-----------------------------------------+------------------------+----------------------+
  | GPU  Name                 Persistence-M | Bus-Id          Disp.A | Volatile Uncorr. ECC |
  | Fan  Temp   Perf          Pwr:Usage/Cap |           Memory-Usage | GPU-Util  Compute M. |
  |                                         |                        |               MIG M. |
  |=========================================+========================+======================|
  |   0  NVIDIA L40S                    On  |   00000000:61:00.0 Off |                    0 |
  | N/A   35C    P0            105W /  325W |       0MiB /  46068MiB |      0%      Default |
  |                                         |                        |                  N/A |
  +-----------------------------------------+------------------------+----------------------+
  |   1  NVIDIA L40S                    On  |   00000000:CA:00.0 Off |                    0 |
  | N/A   36C    P0            102W /  325W |       0MiB /  46068MiB |      0%      Default |
  |                                         |                        |                  N/A |
  +-----------------------------------------+------------------------+----------------------+

  +-----------------------------------------------------------------------------------------+
  | Processes:                                                                              |
  |  GPU   GI   CI              PID   Type   Process name                        GPU Memory |
  |        ID   ID                                                               Usage      |
  |=========================================================================================|
  |  No running processes found                                                             |
  +-----------------------------------------------------------------------------------------+

  ======== GPU REPORT ========

  ==============NVSMI LOG==============

  Timestamp                                              : Mon Jun  8 15:08:15 2026
  Driver Version                                         : 580.159.03
  CUDA Version                                           : 13.0

  Attached GPUs                                          : 2
  GPU 00000000:61:00.0
     Accounting Mode                                    : Enabled
     Accounting Mode Buffer Size                        : 4000
     Accounted Processes
        Process ID                                     : 3072883
              GPU Utilization                            : 12 %
              Memory Utilization                         : 3 %
              Max memory usage                           : 998 MiB
              Time                                       : 86816 ms
              Is Running                                 : 0

  GPU 00000000:CA:00.0
     Accounting Mode                                    : Enabled
     Accounting Mode Buffer Size                        : 4000
     Accounted Processes
        Process ID                                     : 3072884
              GPU Utilization                            : 15 %
              Memory Utilization                         : 3 %
              Max memory usage                           : 998 MiB
              Time                                       : 86868 ms
              Is Running                                 : 0

  Mon Jun  8 15:08:16 2026       
  +-----------------------------------------------------------------------------------------+
  | NVIDIA-SMI 580.159.03             Driver Version: 580.159.03     CUDA Version: 13.0     |
  +-----------------------------------------+------------------------+----------------------+
  | GPU  Name                 Persistence-M | Bus-Id          Disp.A | Volatile Uncorr. ECC |
  | Fan  Temp   Perf          Pwr:Usage/Cap |           Memory-Usage | GPU-Util  Compute M. |
  |                                         |                        |               MIG M. |
  |=========================================+========================+======================|
  |   0  NVIDIA L40S                    On  |   00000000:61:00.0 Off |                    0 |
  | N/A   35C    P0            106W /  325W |       0MiB /  46068MiB |      0%      Default |
  |                                         |                        |                  N/A |
  +-----------------------------------------+------------------------+----------------------+
  |   1  NVIDIA L40S                    On  |   00000000:CA:00.0 Off |                    0 |
  | N/A   36C    P0            102W /  325W |       0MiB /  46068MiB |      0%      Default |
  |                                         |                        |                  N/A |
  +-----------------------------------------+------------------------+----------------------+

  +-----------------------------------------------------------------------------------------+
  | Processes:                                                                              |
  |  GPU   GI   CI              PID   Type   Process name                        GPU Memory |
  |        ID   ID                                                               Usage      |
  |=========================================================================================|
  |  No running processes found                                                             |
  +-----------------------------------------------------------------------------------------+

Method D: Tensorboard visualization of Pytorch profiler data

  • Pytorch profiler is a tool measuring resources consumption of an experiment.
  • Tensorboard is a visualization toolkit that can be used to log and display experiment usage.

Tensorboard should not be launched on login nodes

An example of Tensorboard application on the cluster is described in the Visualizing usage with Pytorch profiler and Tensorboard guide.

Method E: Clusters portals

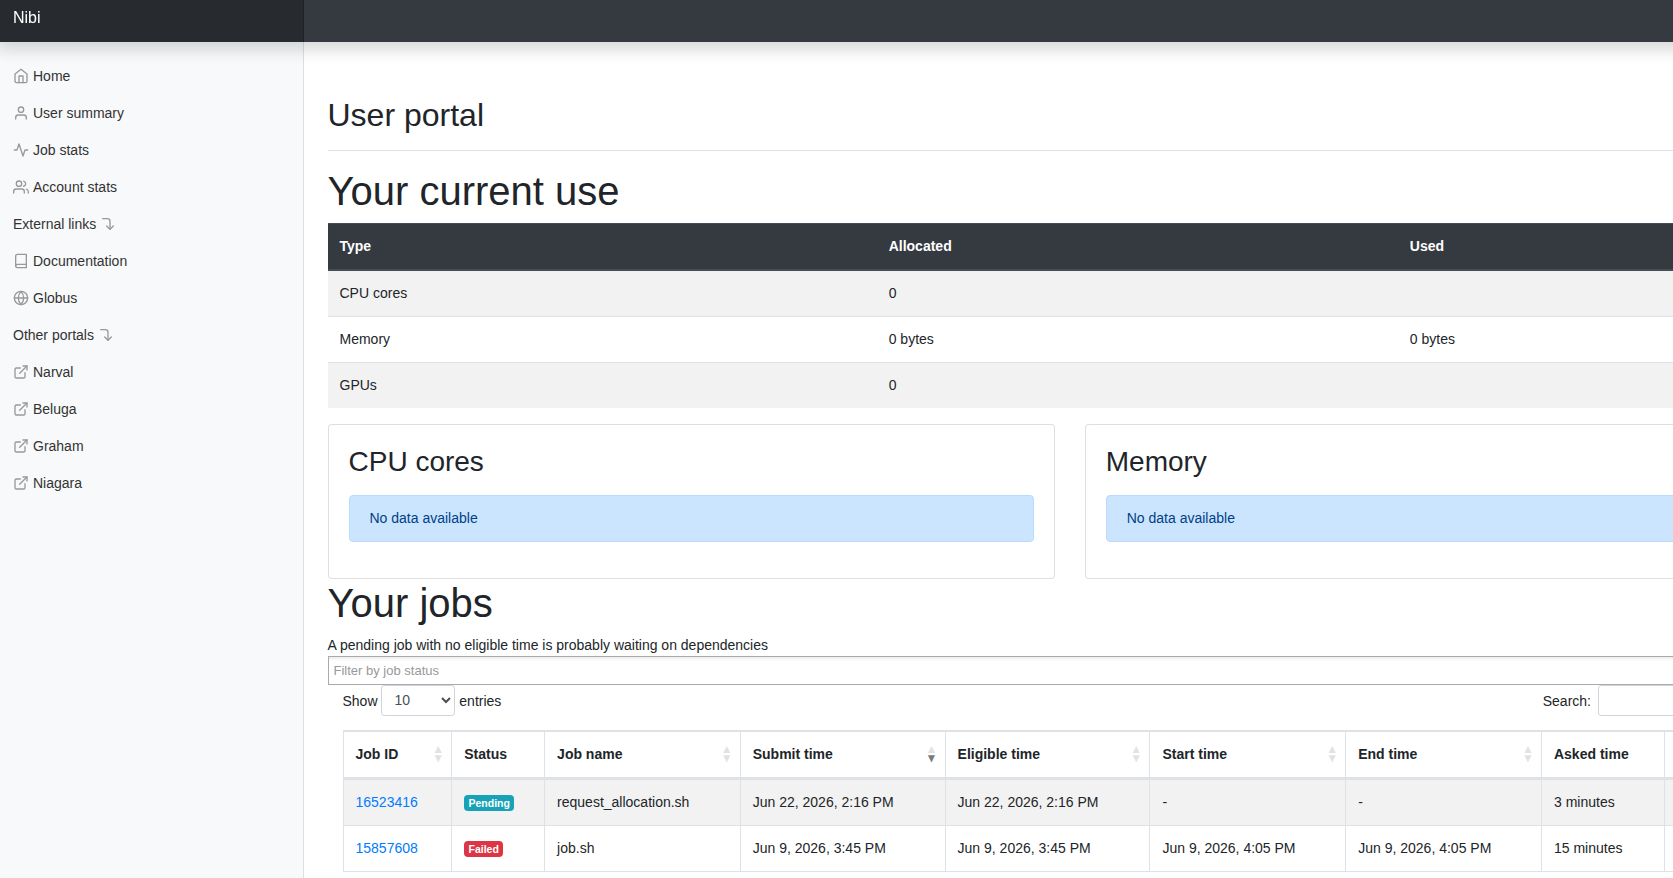
Some clusters you have access to have a related portal which allows to display data and metrics, such as your use of the resources or a history of your jobs.

Here is a quick overview of the clusters and their associated portals (if applicable):

Clusters Maintainer Portal
Mila Mila -
TamIA PAICE TamIA portal
Killarney PAICE -
Vulcan PAICE Vulcan portal
Fir DRAC -
Nibi DRAC Nibi portal
Rorqual DRAC Rorqual portal
Trillium DRAC Trillium portal

Nibi portal

Typical DOs and DON'Ts of compute efficiency

Even if situations are very diverse, the following guidelines pave the way for efficient GPU utilization.

✅ DOs — To improve your runs

  1. Profile before scaling: Run a test job with a profiler (WandB or TensorBoard) before launching large sweeps to ensure your data loader saturates the GPU.
  2. Optimize data pipelines: Set num_workers > 0 (2–4 per allocated GPU) and enable pin_memory=True in your PyTorch DataLoader to prevent GPU stalling.
  3. Implement checkpointing: Save training states regularly so jobs can automatically resume after preemption or timeouts without losing previous compute hours.
  4. Right-size resource requests: Use lower-tier nodes (e.g., RTX8000, V100) or MIG (Multi-Instance GPU) slices for small models or debugging instead of allocating full high-end nodes.
  5. Request minimal compute blocks: When possible, request the smallest allocation that fits your job. Smaller allocations fill queue gaps faster, reducing your wait time.

❌ DON'Ts — Common pitfalls

  1. Hoarding nodes: Do not keep high-end GPUs (e.g., H100s) allocated on interactive partitions while away from your keyboard. Release them if not actively computing.
  2. Avoiding preemption queues: Do not camp on non-preemptible partitions just to avoid writing checkpointing code — this tanks your overall queue priority.
  3. Over-allocating CPU cores: Do not request excessive CPU cores (e.g., 40 CPUs for 1 GPU) unless your preprocessing explicitly requires it. Mila provides CPU-only nodes if needed.
  4. Scaling GPUs to fix I/O bottlenecks: Do not add more GPUs if your pipeline is bottlenecked by storage read latency or CPU preprocessing — you will just idle more hardware.
  5. Underutilizing VRAM: If your VRAM usage is under 20%, consider increasing batch size, switching to a smaller GPU or using job packing (multiple smaller jobs on the same node).

Get help

If you have any questions, feel free to reach out on Slack (#mila-cluster, #compute-canada), or drop by during Office Hours. We are always happy to provide early guidance or share thoughts on how to improve your experiments — in the interest of the community.

You can also use an LLM with curated Mila cluster context to investigate and remove obvious performance issues if you prefer to take matters into your own hands.

Comments