Visualizing usage with Pytorch profiler and Tensorboard
This guide depicts a way to visualize metrics of jobs run on the cluster by using the visualization toolkit Tensorboard alongside Pytorch profiler.
Before you begin
-
Getting started with the Cluster
Get your Mila account, enable cluster access and MFA, then install
uvandmilatoolsto connect via SSH. -
Ask for a resource allocation and launch tasks on the cluster through an interactive job.
-
Managing Python Dependencies with
uv
Install uv, manage project dependencies, run reproducible Slurm jobs, and run standalone scripts.
-
Introduce the notion of profiling.
What this guide covers
- Introduce Pytorch profiler and Tensorboard to log and display metrics
- Launch Tensorboard alongside jobs on the cluster
Description of the process
TensorBoard reads profiling data from a directory that you specify when launching it. Visualizing a job's performance with TensorBoard involves two steps:
- Recording profiling data: PyTorch Profiler writes trace files to the directory during the job's execution.
- Viewing the metrics: TensorBoard is launched pointing to that directory, either while the job is still running or after it has finished.
Recording profiling data
Info
This guide is based on the following guides from the Pytorch documentation:
You can refer to them for more details.
Base code
The following code is an example of training a model with Pytorch:
How to use Pytorch profiler
Metrics are written with profile from the torch.profiler
library. Below is a template to understand how to add it to
a model training code:
Ready-for-use code
Below is an example of putting it all together. It is ready to be run:
Try the example locally
Launching the example locally is done through the following steps:
- Write the experiment code
- Set up the environment
- Launch the experiment
- Launch Tensorboard
- Access Tensorboard visualization
Write the experiment code
We use the code explained in the previous section.
Set up the environment
The environment is described in the following file. Copying it as pyproject.toml would make available all the prerequisites
while running the uv command.
Launch the experiment
Once the two files (experiment.py and pyproject.toml) have been written in your environment, you can
launch the experiment through the following command:
The folder fake_scratch/logs/0 has been created.
Launch Tensorboard
Tensorboard can be launched whether the job is running or has ended, this is done through the command:
Access Tensorboard visualization
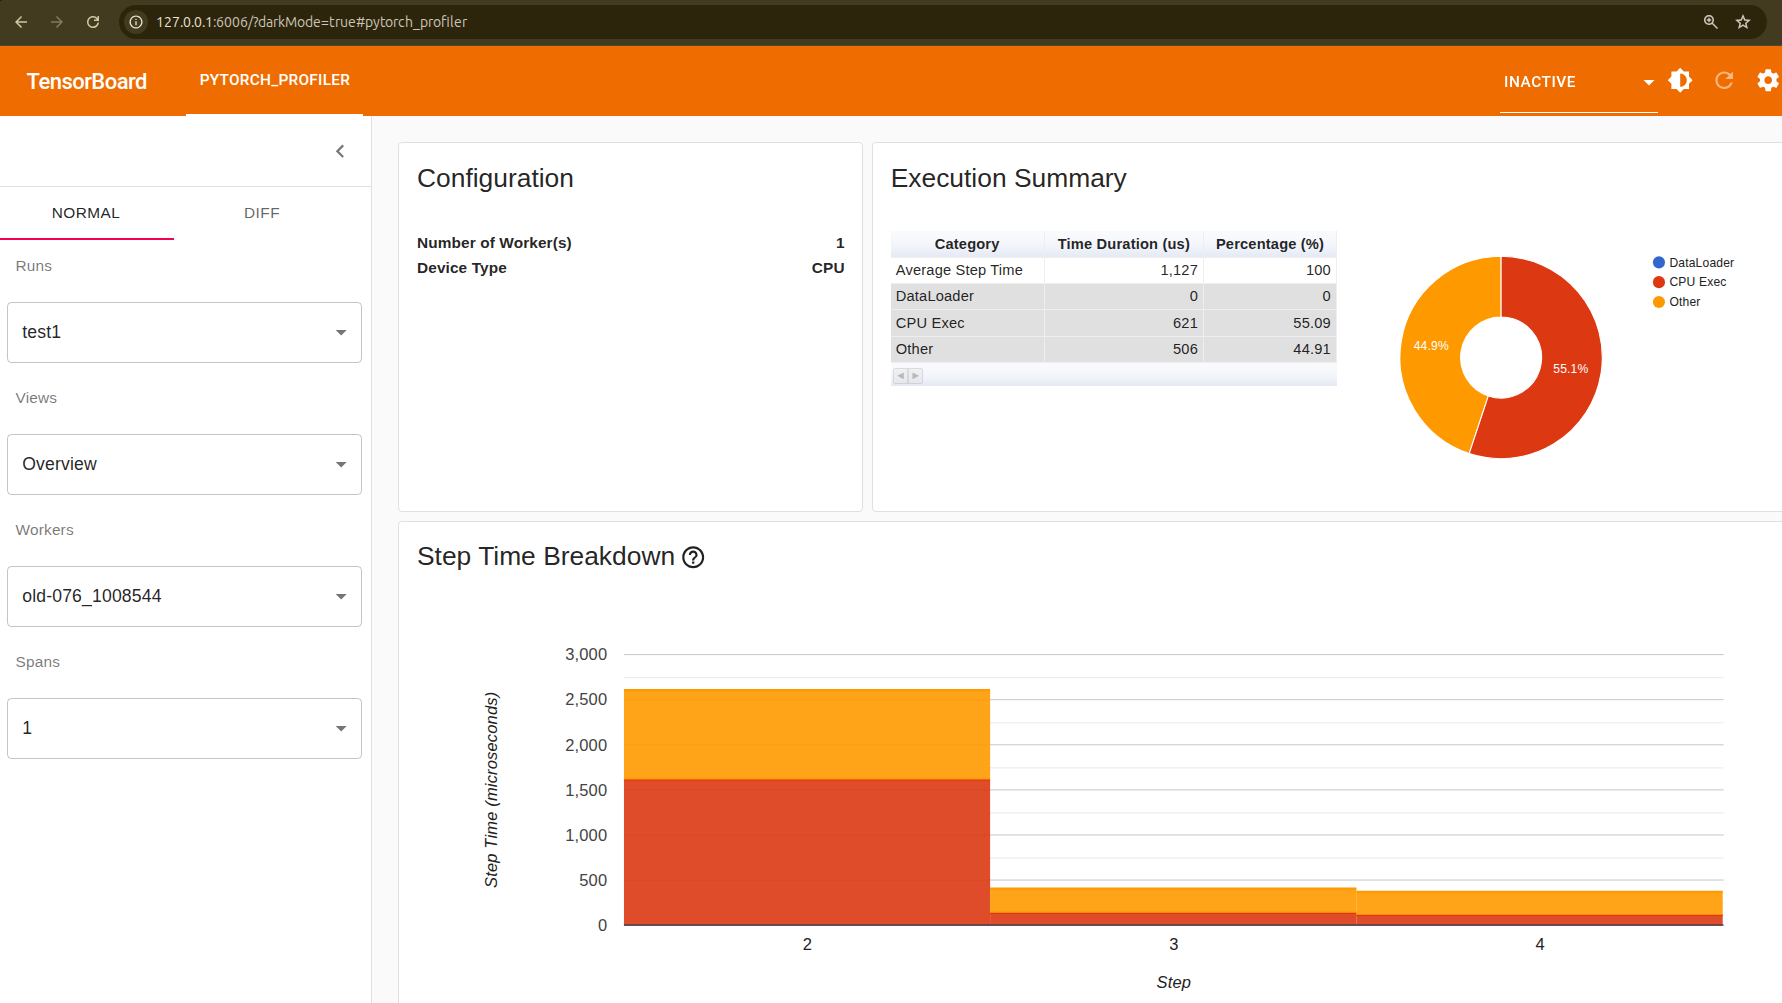
You can access Tensorboard interface through localhost, the default port is 6006. To this end, open a browser and enter 127.0.0.1:6006 in the address bar.
The following dashboard appears:
Launch this example on the cluster
Now is time to launch a job on the cluster and benefit the shared compute resources to run experiments. Below are described two methods to visualize metrics of a job on the cluster:
- Using milatools and VSCode
- Using command lines.
Steps overview
- From a local terminal :
ssh mila 'mkdir -p CODE/tensorboard_test' - From a local terminal :
mila code CODE/tensorboard_test --alloc --gres=gpu:1 --cpus-per-task=2 --mem=16G --time=01:00:00 - In VSCode : create the files
experiment.pyandpyproject.toml - From the VSCode terminal :
uv run python experiment.py - From the browser, access Tensorboard on browser.
- Connect to the cluster :
ssh mila - Set up the project for the cluster :
mkdir $SCRATH/tensorboard_test,cd $SCRATCH/tensorboard_test,vim experiment.py,vim pyproject.toml - Launch the experiment :
vim job.shandsbatch job.sh - Launch Tensorboard :
sallocthenuvx tensorboard --logdir $SCRATCH/logs/$SLURM_JOB_ID - From the browser, access Tensorboard on browser.
Detailed steps
Create directory and allocate resources
From your local terminal, create the project directory on the cluster and launch VSCode connected directly to an allocated compute node:
What mila code does
mila code requests an interactive Slurm allocation on a compute node and automatically opens a VSCode remote session attached to that node.
Create the experiment files
Once VSCode launches and connects to the cluster node:
- Open the File Explorer (
Ctrl+Shift+E/Cmd+Shift+E/ View -> Explorer). - Create
experiment.pyandpyproject.tomlusing the templates from the Ready-for-use code section.
Run the experiment
Open the integrated VSCode terminal ( View -> Terminal ) and start the experiment:
This will generate performance trace logs inside $SCRATCH/logs/$SLURM_JOB_ID.
Launch TensorBoard
Do not launch Tensorboard on the login node
Login nodes exist for light interactive tasks. TensorBoard must be run on a compute node to avoid overloading login nodes for other users.
In the VSCode terminal, run TensorBoard using uvx:
Access TensorBoard visualization
VSCode automatically detects listening network ports on the compute node and forwards them to your local machine.
Open your local web browser and navigate to: http://127.0.0.1:6006
Connect to the cluster
Connect to a login node from your local terminal:
Set up the project directory and files
Create your project directory under $SCRATCH and navigate into it:
Create experiment.py and pyproject.toml (using a text editor like vim or nano) based on the code provided in Ready-for-use code.
Launch the experiment
Create a Slurm job script named job.sh:
Submit the job to Slurm:
Take note of the Job ID printed in your terminal output (e.g., Submitted batch job 1234567).
Launch TensorBoard
Do not launch Tensorboard on the login node
Always launch TensorBoard inside a compute node allocation.
Request an interactive allocation on a compute node, then start TensorBoard:
<JOB_ID> with the actual ID of your experiment job).
Next, establish an SSH tunnel in a new tab on your local terminal:
<NODE_NAME> with the compute node name assigned to your salloc job.)
Node name
An example of a node name is cn-f003. A list of the Mila cluster's nodes
can be found in the Mila cluster nodes pages.
Access TensorBoard visualization
Open your local browser and navigate to: http://127.0.0.1:6006
Changing ports
If port 6006 is already occupied on your machine, specify --port <PORT> when running TensorBoard and update your SSH forwarding rule accordingly.
Key concepts
- SSH port forwarding
- Also called "SSH tunneling", it is an operation where a machine listens on a specific port, and transfers it to a (potentially other port) on another machine. More info here